
Make a Chart
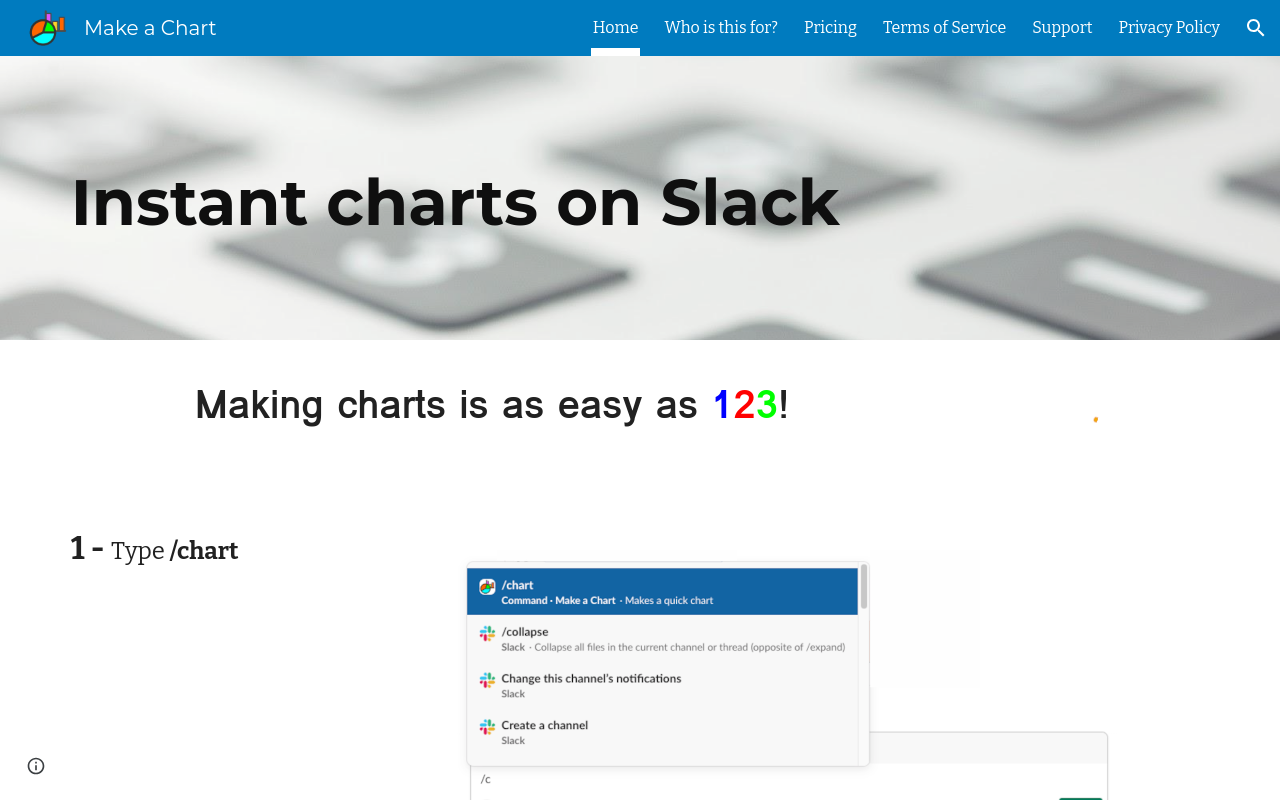
Make a Chart turns data into professional charts in minutes, with imports from Excel, Google Sheets, and CSV, plus customization and real-time collaboration.
Make a Chart
A Simple yet Powerful Chart-Building Tool
Overview
Make a Chart is a revolutionary tool that empowers anyone to create professional-looking charts in minutes. With a user-friendly interface and a wide range of customization options, you can easily create visual representations of your data, presenting it in a clear and compelling way.
Key Features and Benefits
Easy Chart Creation
Create charts from scratch or import your data from various sources such as Excel, Google Sheets, or CSV files.
Customization Options
Customize your chart's design, colors, fonts, and layout to match your brand's style and preferences.
Real-time Collaboration
Invite team members or stakeholders to collaborate on your chart in real-time, making it easier to get feedback and track progress.
Data Analysis and Insights
Make sense of your data with built-in analysis and insights tools, helping you identify trends, patterns, and correlations.
Export and Share
Export your chart in various formats (PDF, PNG, JPEG, SVG) and share it with others via link or embed it in your website or presentation.
Use Cases or Applications
- Business: Use Make a Chart to present sales data, track product performance, or create dashboards for performance monitoring.
- Education: Create interactive charts and infographics to illustrate complex concepts and make learning more engaging.
- Research: Visualize research findings, track trends, and share insights with colleagues and stakeholders.
Unique Selling Points
- Drag-and-Drop Interface: Make a Chart's intuitive interface allows you to create charts without requiring advanced technical skills.
- Data Import and Export: Seamlessly import data from various sources and export charts in various formats.
- Real-time Collaboration: Work with others in real-time, making it easier to get feedback and iterate on your chart.
Get started with Make a Chart today and turn your data into powerful, engaging visualizations that drive insights and action!
FAQ
Frequently asked questions
What is Make a Chart?
Make a Chart is a AI tool listed on aifly.tools that adds new capabilities to your AI coding agent. See the description and screenshots above for what it does.
How do I install Make a Chart?
Click the Visit button below to open the official website and sign up there.
Is Make a Chart free?
Yes — Make a Chart is free to install. Some skills may still need an API key for the underlying service they call.
How do I update Make a Chart?
Open the official website with the Visit button below and check for the latest version there.


